In the last two posts, I described the first steps in modeling the total annual cost as a function of the total medical charges. In the post Medical Insurance Project, I described the basic idea behind the project and how students can collect and organize information on health insurance plans. In the post Medical Insurance Project – Calculate the Total Annual Cost, I described how students create table of values including several total medical charges and the corresponding cost.
Once the students have an appropriate table, they need to graph the data.
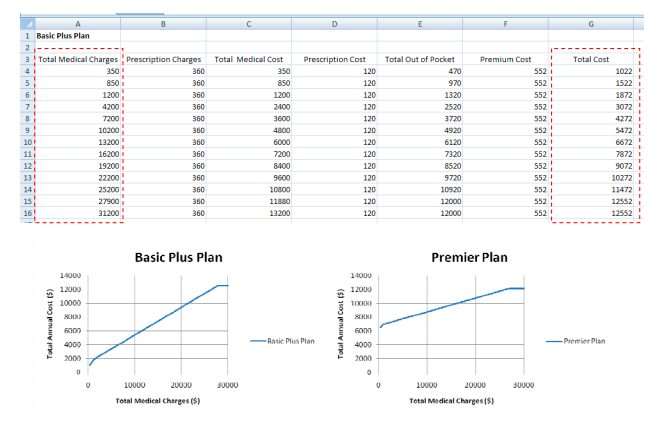
In the next technology assignment, student learn how to make a line graph of the total medical charges versus the total annual charges.
Technology Assignment: Graph the Total Annual Cost (PDF)
Upon completing this assignment, students will have a graph for each health insurance plan like the ones below.
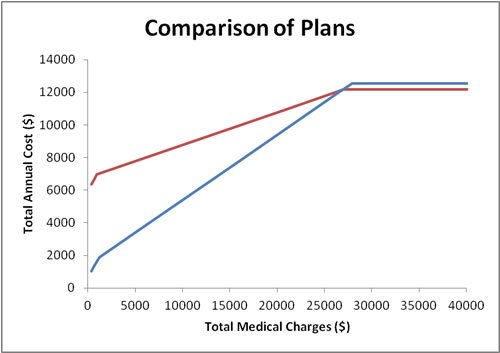
To compare these graphs, it is convenient to have them on the same graph. In the next technology assignment, students put these two graphs together and find the piecewise linear functions corresponding to each health plan.
Technology Assignment: Find Piecewise Linear Models (PDF)
With the graphs together, it is much easier to compare the total costs.
Once students have put these graphs together, hopefully they will make the next logical step which is to find the point of intersection using the piecewise functions.
If the students get to this point successfully, they are over the major hurdles of this project. Next they need to document their solution strategy. I’ll describe the document they turn in for this project in my next blog post.


